Market Size of a product/service is necessary for every business. But why?
It’s an indicator that can help you assess the profit potential of your business. You always want to be a step ahead of your competitor(s) when doing business and want to be market leader in your field. To achieve this, you launch some new products based on changing market scenarios or diversify your offerings based on consumer requirements or expand your business to new regions or do collaboration or acquisition to get access to new technology etc.
All these activities involve estimating the size/potential of market in terms of revenue and volume so that you can be aware of – what you are getting into? What sort of investment is needed? and take informed decisions driven by the market intelligence data.
Some key market sizing matrices you should be aware of, and which are useful for effective decision making are Total addressable Market (TAM), Serviceable Available Market (SAM), Serviceable Obtainable Market (SOM).
But again, what is TAM, SAM, SOM? And how to calculate market size? You may ask!
Importance of the Service
Organizations often rely on ready-made/syndicated research reports which are generally out-of-date and cover only the surface level information about the market. But dynamics (like Covid 19, looming threat of wars, regulatory and other supply chain issues) are very volatile and directly influence Primary Indicators like revenue model, assumptions, and Macroeconomic Indicators etc. This could badly dent the estimation model.
If estimation is done based on old data, the estimation model will yield faulty results. Market numbers which used to make sense in the last quarter don’t even come close now. This implies that the market sizing is most effective with fresh data that reflects the market numbers as they stand today not as they were in the last quarter, or last year.
In fact, routine/periodic market sizing is a popular choice among many of our clients who are market share leaders in their respective markets. Routine market sizing allows them to be ready with updated market numbers so that they can always be a step ahead of the competition. It also helps them understand matrices like TAM, SAM and SOM for their product or service. Let me explain the function of each of these market sizing matrices for easy reference.
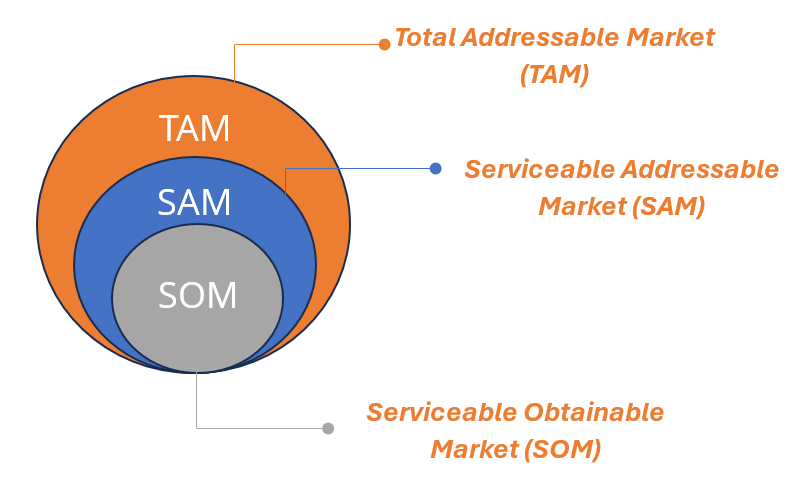
Total Addressable Market (TAM):
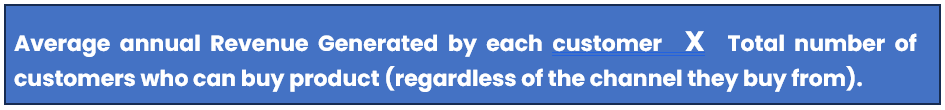
As the name suggests, the total addressable market refers to the total revenue potential that a product or service has or can generate. That is, 100% market share of the target product or service (probably unattainable for one company but it reflects the total potential of the market). It represents the total market demand regardless of any barriers or competition in the market.
So, if you want to find the TAM for your product, you can use following formula:
Serviceable Addressable Market (SAM)
SAM is a subset of the TAM, and it reflects the portion of the TAM that can be catered with your product or service. It reflects the demand by factoring in barriers such as competition, distribution capacity, dealership network and supply chain.
The serviceable addressable market could be calculated using the following formula:

In this example we have consider the e-com channel as the filter factor for sales channel
Serviceable Obtainable Market (SOM)
The serviceable obtainable market refers to the portion of the market your business can realistically capture. The SOM in simpler terms reflects the company’s current market share.
To calculate the SOM for your product, you can use the following formula:

How to calculate Market Size?
There are many things that go into an efficient market sizing model. Things like – Market size of Macro/Micro Market, Revenue Modeling for the Market, indicators from primary interviews, assumptions or considerations which could influence the market, indicators from regulatory landscape etc. Once you have collected the data from both secondary and primary sources, you need to identify such indicators and feed the data into the model to arrive at market sizing numbers.
A well-rounded market sizing model is built on a combination of top-down and bottom-up data modeling approach. Again, a new term you would say! Let me explain.
Top-Down Market Sizing Approach: The top-down analysis would focus upon estimating the overall market size and breaking it down by major competitors. In the top-down approach you identify the total market size i.e., total size of the product service first based on available information in the secondary domain and then factor in potential indicators like demographic, regulatory, economic, and assumptions to rule out or eliminate noise. Based on these indicators you break down the market share to arrive at market size estimates through the process of elimination.
Bottom-Up market Sizing Approach: The bottom-up analysis would focus upon independently determining the market share of major competitors and bring it up to estimate the market size. In the bottom-up approach you start with the share and revenue of each of the competitors individually factoring in all the necessary indicators. You then add the all the competitor shares and revenue to identify the total market share.
At Infiniti we have large team of seasoned researchers with hands on experience in creating an exhaustive and error free market sizing model and experts for conducting interviews with the industry stakeholders and statisticians who understand the target industry etc. This team approach provides an optimal mix of subject matter experts and cultural talent, as well as support from QA associates. So, we can help you factor in complex indicators in to our model and get an accurate picture of the market.
How Infiniti Research incorporated Market Sizing Methods?
Our client was a cloud services company and they wanted to find out what is the Market size of private cloud services excluding managed cloud service to target enterprises in the USA. We scoped out the requirement and created the statement of work. Our task was to estimate market size, CAGR, information on the trends, drivers, and challenges etc.
Our team started with secondary research. We collected information from all available resources in the secondary domain such as the company website, annual reports, analysts’ reports, proprietary and paid databases to gather all the available information of interest.
We built the hypothesis based on secondary research and identified the data gaps. Then a team our interview experts conducted telephone interviews with key industry stakeholders to collect their inputs and fill any gaps in the findings of the secondary research phase.
The findings from primary and secondary research were thoroughly analyzed and key indicators and data pointers are identified. Then it was time to build the market sizing model and do the calculations.
We used a combination of top down and bottom-up market model to estimate the market size.
- We started with the top-down approach. For that we first identified the total size of the cloud services market based on the industry reports. Say USD 100 Billion.
- As a second step we identified the share contribution percentage of private cloud services. Say 20%.
- Multiplying both the above numbers i.e., A*B gave us the market size of the private cloud services market. (100*20% = USD 20 Billion)
- Further we had to exclude the managed cloud market, so we used information from primary research to identify the share contribution percentage of managed cloud services market. Say 19%.
- In terms of value the share of managed cloud services market can be calculated by multiplying pointers C and D (C*D = 20*19% = USD 3.8 Billion)
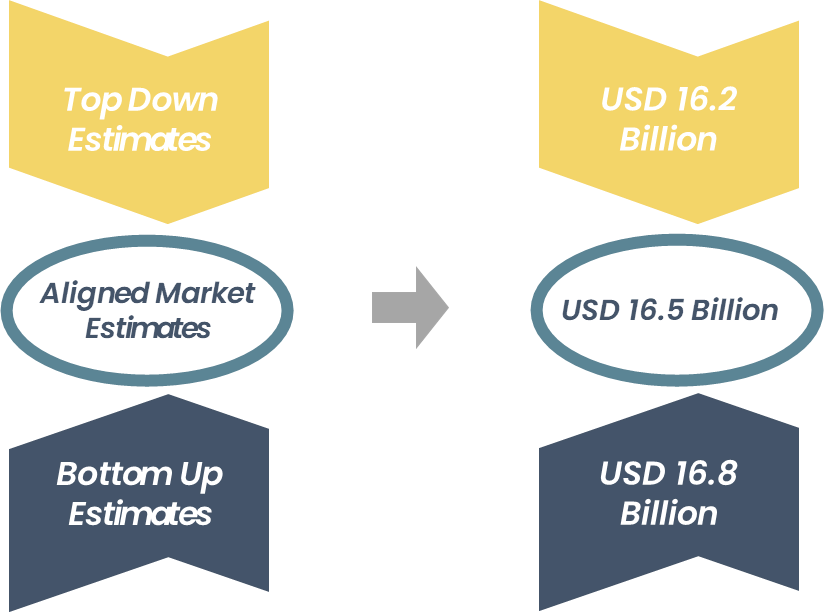
- Finally, to arrive at the market size of cloud services market excluding managed cloud services market can be calculated by subtracting e from c (i.e., C-E = 20-3.8 = 16.2). Therefore, the required size by value is USD 16.2 Billion.
However, we also validated the information using bottom-up approach.
- We started by identifying the global revenue of each of the top competitors individually.
- As the second step we identified each of their sales percentages in the US market (share in the target market).
- On multiplying 1*2 we got the market share by value for each of the top 5 competitors in the target market.
- Adding the share of each competitor gave us coverage of 50% of the market. In terms of value the share translated to say USD 8.4 Billions. Based on this calculation the 100% of market should be (8.4/50% = 16.8) USD 16.8 Billions.
For effective estimation both top-down and bottom-up models must align then only you can consider your market size estimates to be accurate. You might need to recheck or adjust some of your assumptions to reach the accurate number.
The calculations above are done based on a simple use case that company only has one product segment. But in markets like cloud services market the buyer doesn’t generally offer one type of service. For example, in the above use case our client wanted us to dissect the private cloud services market by type of service, and by end users to understand the potential of different market segments. In such cases we need to estimate the market size for each segment, which is a complex process.
Market segmentation is worthy of a separate article of its own. So, to avoid the risk of making this piece too long I will write another piece of article on market segmentation later.
Summary of Case Study: Second last para should be more inclined to convert readers to use our service.
A combination of both the models is necessary to triangulate the data and make sure the market size estimates, and the entire data estimation model are free from errors. Model output coupled with multiple validations from primary and secondary sources would ensure that the entire data estimation model is free of errors and incorrect assumptions.
Conclusion
You can talk to our expert, and we will help you out with all your questions. Talk to our experts now.
Author’s Details:
Gaurav Sharma, Assistant Manager – Presales, Custom Market Intelligence